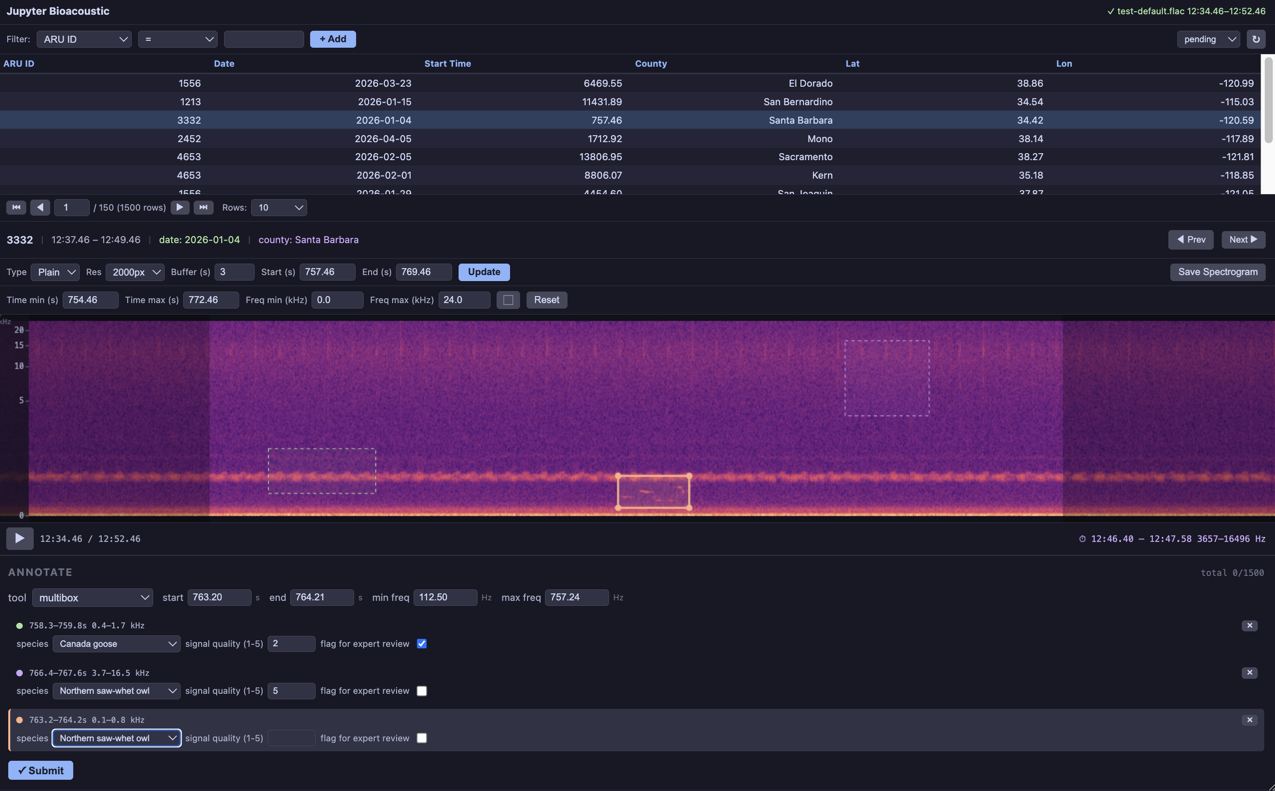
This example uses config
specified the columns to be shown in the filterable/sortable list
added columns to be displayed in the “info card” when a clip is selected
changed the text on the “capture” button to “Save Spectrograms” and specifed a default director for the visualizations
enabled all 4-types of time annotation (time_select, start/end_time_select, bounding-box, multibox)
required speices labeling attacted to time annotations (so each multibox can be labeled independently)
additional form types (number-box and checkbox)
Author: Brookie Guzder-Williams (bguzder-williams@berkeley.edu)
Affiliation: The Eric and Wendy Schmidt Center for Data Science & Environment
Website: https://dse.berkeley.edu/
License: BSD 3-Clause
For configuration options and advanced usage see the documentation and the geo-analysis example. See simpleBioacousticAnnotator.
from jupyter_bioacoustic import BioacousticAnnotator

DATA = 'data/detections.N-dse.csv'
AUDIO = 'audio_uri_public'
CATEGORIES = 'data/species_counts.N-dse.csv'
[JBA] Debug mode enabled. Logs → /Users/brookie/code/dse/jupyter_bioacoustic/repos/jupyter_bioacoustic/demo/jba_debug.log
ba = BioacousticAnnotator(data_path=DATA, audio=AUDIO, config='annotator_config/config/data-collection-example.yaml')
ba.open()
---------------------------------------------------------------------------
FileNotFoundError Traceback (most recent call last)
Cell In[2], line 3
1 #| label: nb.data-collection-example
2 #| placeholder: ../assets/app/data-collection-mbox.png
----> 3 ba = BioacousticAnnotator(data_path=DATA, audio=AUDIO, config='annotator_config/config/data-collection-example.yaml')
4 ba.open()
File ~/code/dse/jupyter_bioacoustic/repos/jupyter_bioacoustic/jupyter_bioacoustic/api.py:1117, in BioacousticAnnotator.__init__(self, project, config, form_config, data, data_path, data_url, data_sql, data_api, data_start_time, data_end_time, data_duration, data_secrets, data_index_column, audio, audio_src, audio_path, audio_url, audio_uri, audio_column, audio_prefix, audio_suffix, audio_fallback, audio_secrets, audio_sql, audio_api, audio_property, audio_response_index, output, output_path, output_url, output_uri, output_sync_button, output_recursive, output_secrets, output_index_column, description, description_title, description_text, description_path, description_open, description_height, secrets, project_name, display_columns, info_card_title, info_card_text, info_card_height, visualizations, spectrogram_resolution, default_buffer, capture, capture_dir, capture_height, clip_table_height, player_height, form_panel_height, width, partial_download, duplicate_entries, sort, sort_order, session_args, **kwargs)
1113 if config not in (_UNSET, None):
1114 _log.info(
1115 'loading config file: %s', config,
1116 )
-> 1117 cfg = _load_config(config)
1118 self._config_file = config
1119 self._config_cfg = dict(cfg)
File ~/code/dse/jupyter_bioacoustic/repos/jupyter_bioacoustic/jupyter_bioacoustic/api.py:596, in _load_config(path)
594 return json.load(f) or {}
595 else:
--> 596 with open(path) as f:
597 return yaml.safe_load(f) or {}
FileNotFoundError: [Errno 2] No such file or directory: 'annotator_config/config/data-collection-example.yaml'