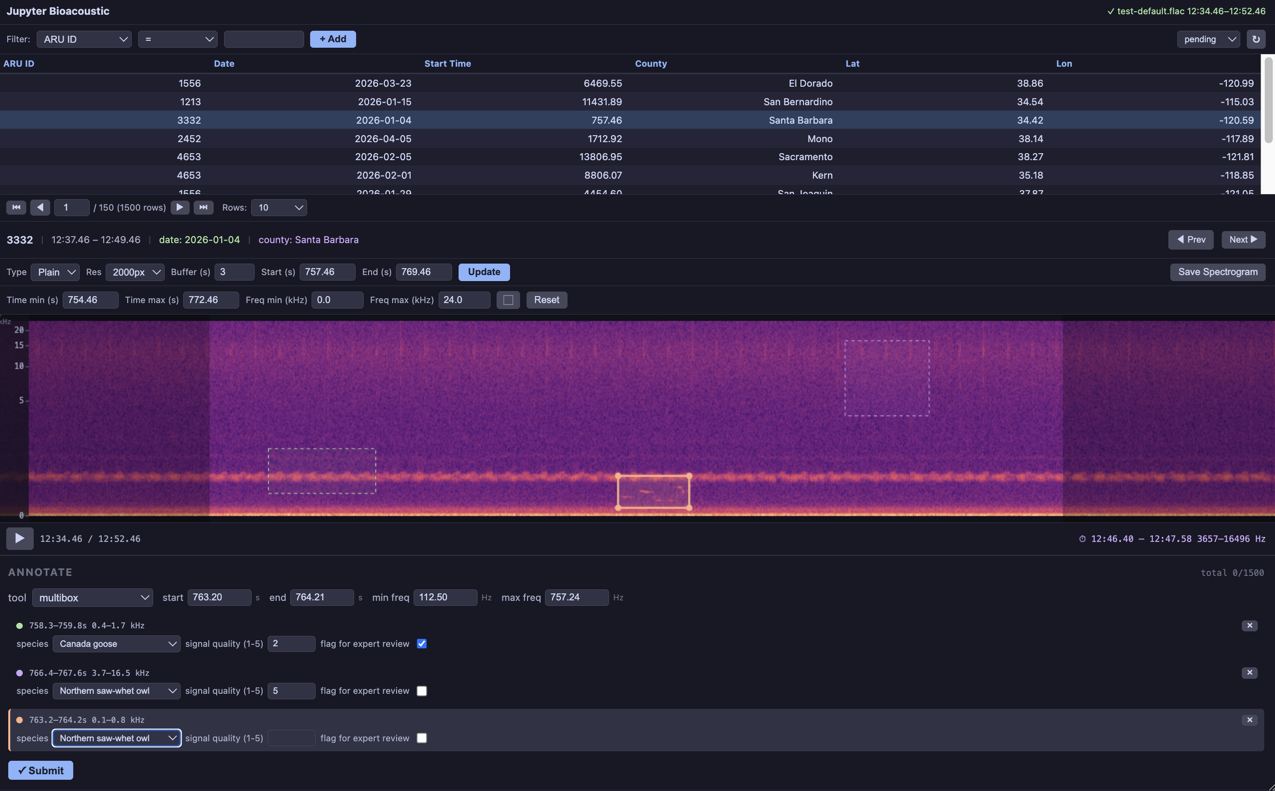
The annotation form element adds interactive tools for marking time positions and frequency-time regions. Four annotation tools are available:
time_select: a single time markerstart_end_time_select: time markers for both start and end timesbounding_box: draw and label a bounding box (start/end-time, min/max-frequency)multibox: draw and label multiple bounding boxes on a single visualization
Without an annotation element in the form config, the spectrogram has no click/drag interaction. When multiple tools are listed, a dropdown appears in the form panel to switch between them.
Time Select
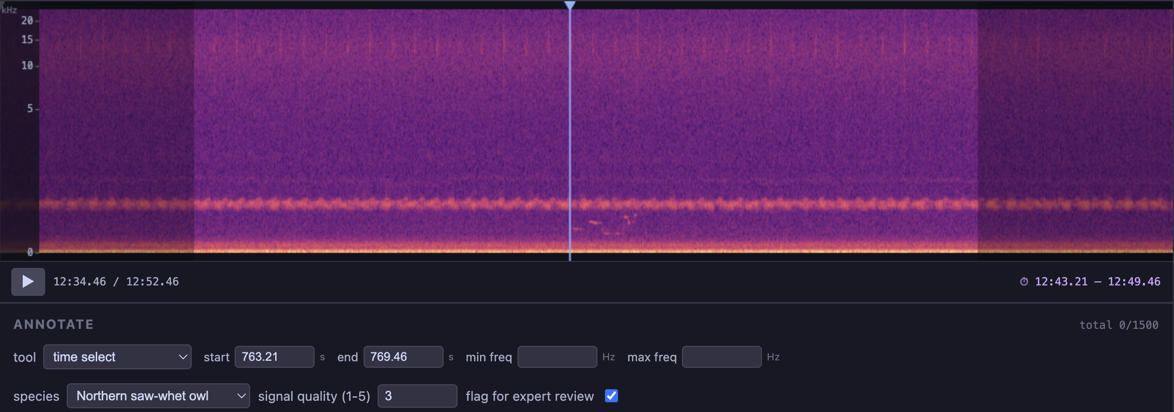
A single vertical line spanning the full spectrogram height. Click anywhere to place it, or drag the handle at the top to reposition.
Records a single
start_timevalueUseful for marking the onset of a vocalization or event
annotation:
    start_time:
        label: start
        column: start_time
        source_value: start_time
    tools: time_select
When tools is a string instead of a list, no dropdown is shown — the tool is used directly.
Start/End Time Select
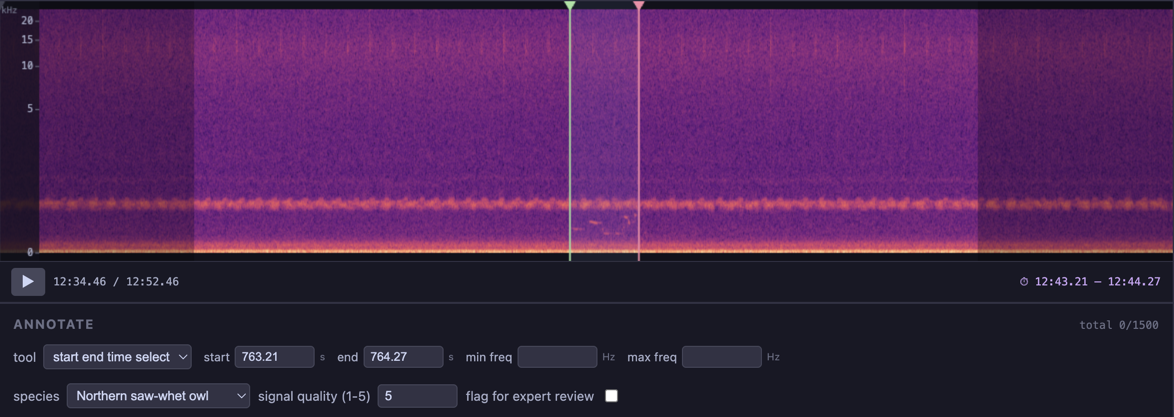
Two vertical lines — green for start, pink for end — with a shaded region between them. The lines are constrained so they cannot cross each other. Click near a line to grab and drag it.
Records
start_timeandend_timeUseful for marking the duration of a call or song
annotation:
    start_time:
        label: start
        column: start_time
        source_value: start_time
    end_time:
        label: end
        column: end_time
        source_value: end_time
    tools: start_end_time_select
Bounding Box
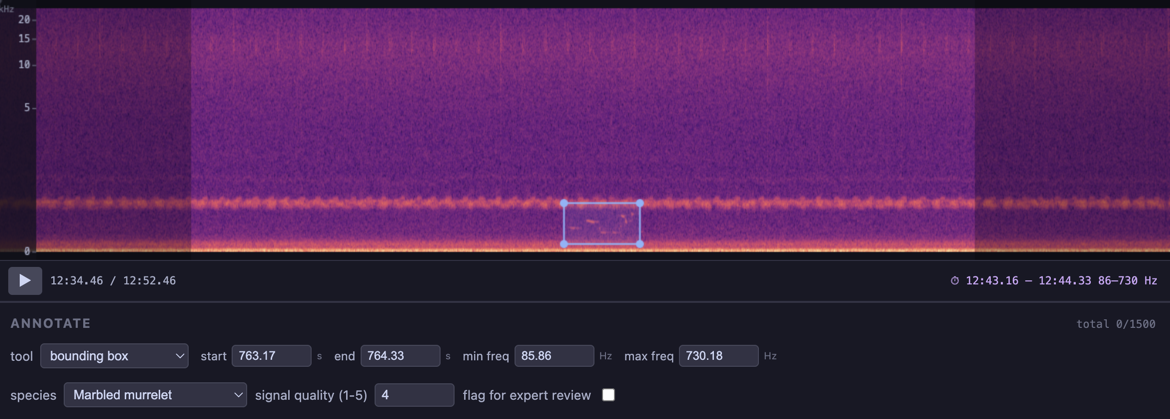
A rectangle defined by time (x-axis) and frequency (y-axis). Click and drag on empty space to draw a new box. Individual edges can be dragged to resize.
Records
start_time,end_time,min_frequency,max_frequencyFrequency values are correctly mapped for linear, mel, and log frequency scales
annotation:
    start_time:
        label: start
        column: start_time
        source_value: start_time
    end_time:
        label: end
        column: end_time
        source_value: end_time
    min_frequency:
        label: min freq
        column: min_freq
    max_frequency:
        label: max freq
        column: max_freq
    tools: bounding_box
Multibox
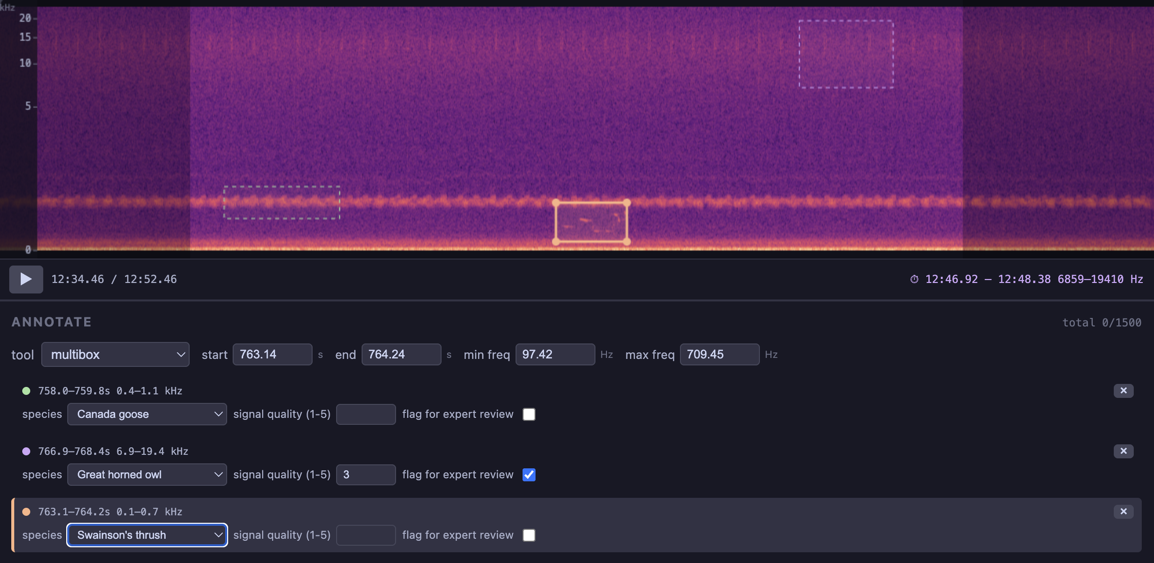
Draw multiple bounding boxes on a single spectrogram. Each box is color-coded and can have its own form values (e.g. a species label per box). On submit, one output row is written per box.
Draw on empty space to create a new box
Click an existing box to select it (highlighted with solid border and handles)
Drag edges of the active box to resize
Press Delete or Backspace to remove the active box
The x button on each box’s form card also removes it
annotation:
    start_time:
        label: start
        column: start_time
        source_value: start_time
    end_time:
        label: end
        column: end_time
        source_value: end_time
    min_frequency:
        label: min freq
        column: min_freq
    max_frequency:
        label: max freq
        column: max_freq
    tools:
        - bounding_box
        - multibox
    form: label_form
dynamic_forms:
    label_form:
        - select:
              label: species
              column: common_name
              required: true
              items:
                  path: data/categories-small.csv
                  value: common_name
The form key references a section in dynamic_forms. For multibox, each box gets its own instance of that form. For all other tools, a single instance is shown alongside the annotation inputs.
Combining Tools
List multiple tools to let the user switch between them from a dropdown:
tools:
    - time_select
    - start_end_time_select
    - bounding_box
    - multibox
Values for all configured fields are always written to the output regardless of which tool is active.
Configuration Fields
Each annotation field accepts:
| Key | Description |
|---|---|
label | Display label next to the numeric input |
column | Output column name |
source_value | Column from the input row to initialize the value |
min_frequency and max_frequency can also be specified as a simple string (the output column name) instead of a dictionary:
min_frequency: min_freq
max_frequency: max_freq
Full Example
The Data Collection notebook demonstrates all four tools with per-annotation species labeling: