Quickstart

Run your first Josh simulation with joshpy in under 5 minutes.

1. Install joshpy

pip install joshpy[all]

2. Run a Simulation

joshpy wraps the Josh CLI to run simulations. Here’s a minimal example:

from pathlib import Path
from joshpy.cli import JoshCLI, RunConfig

# Create CLI (auto-downloads Josh JAR if needed)
cli = JoshCLI(josh_jar=Path("../../jar/joshsim-fat.jar"))

# Run the quickstart simulation
# Note: The .josh file defines the output path as /tmp/quickstart_output.csv
result = cli.run(RunConfig(
    script=Path("../../examples/quickstart.josh"),
    simulation="Main",
    replicates=1,
))

print(f"Success: {result.success}")
print(f"Exit code: {result.exit_code}")
if not result.success:
    print(f"Error: {result.stderr}")
Success: True
Exit code: 0

3. Load and Plot Results

Load the simulation output into pandas and create a simple visualization:

import pandas as pd
import matplotlib.pyplot as plt

# Load results (path defined in quickstart.josh as exportFiles.patch)
df = pd.read_csv("/tmp/quickstart_output.csv")
print(f"Loaded {len(df)} rows")
df.head()
Loaded 243474 rows
position.longitude position.x averageHeight position.y position.latitude treeCount averageAge step replicate
0 -114.616293 72.5 0.495414 1.5 33.686510 10 1 0 0
1 -114.670342 67.5 0.499181 20.5 33.515639 10 1 0 0
2 -115.210829 17.5 0.635512 12.5 33.587585 10 1 0 0
3 -114.637913 70.5 0.530018 22.5 33.497653 10 1 0 0
4 -114.605483 73.5 0.451775 22.5 33.497653 10 1 0 0
Figure 1: Tree growth over 10 timesteps
# Plot tree height over time (aggregated across patches)
summary = df.groupby("step")["averageHeight"].mean().reset_index()

plt.figure(figsize=(8, 4))
plt.plot(summary["step"], summary["averageHeight"], marker="o")
plt.xlabel("Timestep")
plt.ylabel("Average Height (m)")
plt.title("Tree Growth Over Time")
plt.grid(True, alpha=0.3)
plt.tight_layout()
plt.show()
Figure 2: Average tree height increases over time

What Just Happened?

The quickstart.josh simulation:

  1. Creates a grid spanning ~30km x 100km in the Mojave Desert
  2. Places 10 trees in each patch (grid cell)
  3. Each tree grows randomly 0-1 meters per timestep
  4. Exports average height and tree count at each step

View the simulation source:

print(Path("../../examples/quickstart.josh").read_text())
# Quickstart simulation - a minimal Josh example
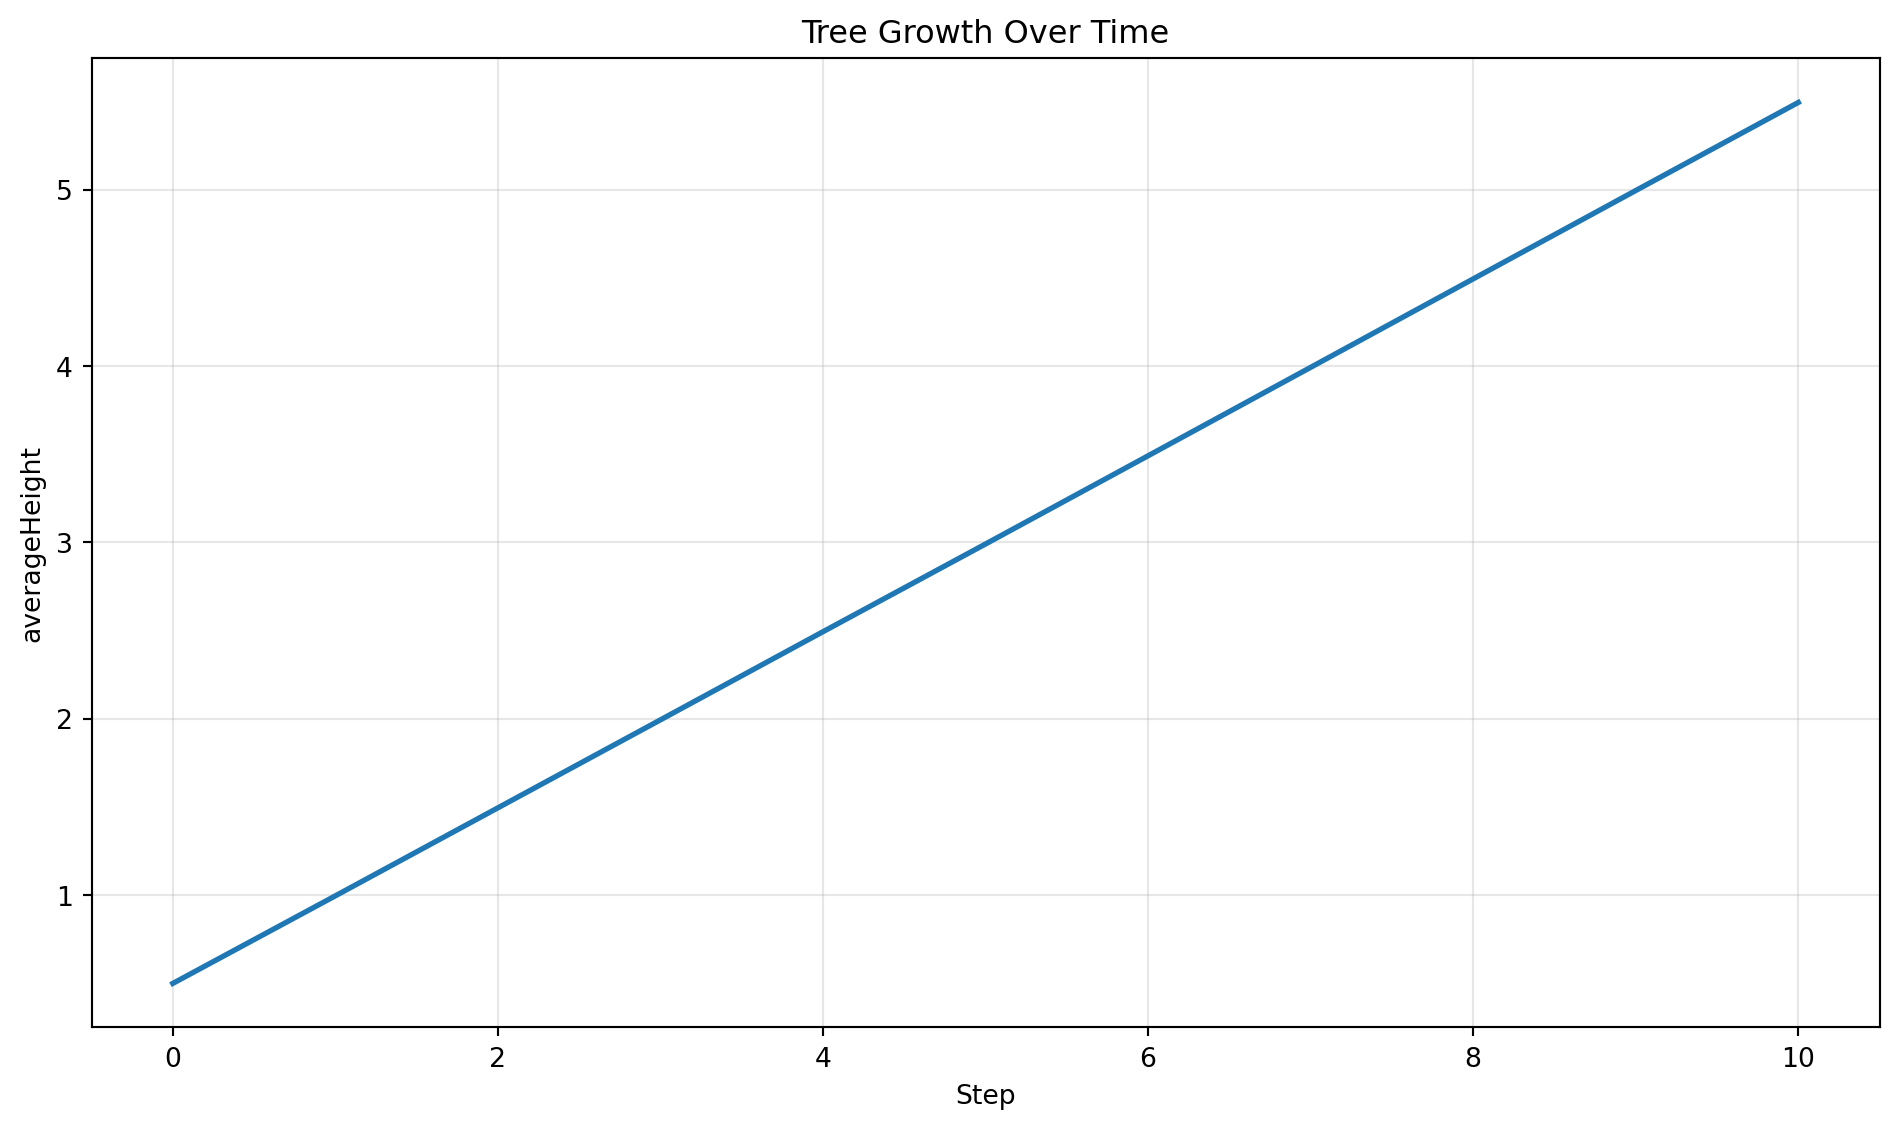
# Simulates tree growth over 10 timesteps on a small grid

start simulation Main

  grid.size = 1000 m
  grid.low = 33.7 degrees latitude, -115.4 degrees longitude
  grid.high = 34.0 degrees latitude, -116.4 degrees longitude
  grid.patch = "Default"

  steps.low = 0 count
  steps.high = 10 count

  exportFiles.patch = "file:///tmp/quickstart_output.csv"

end simulation

start patch Default

  ForeverTree.init = create 10 count of ForeverTree

  export.treeCount.step = count(ForeverTree)
  export.averageAge.step = mean(ForeverTree.age)
  export.averageHeight.step = mean(ForeverTree.height)

end patch

start organism ForeverTree

  age.init = 0 year
  age.step = prior.age + 1 year

  height.init = 0 meters
  height.step = prior.height + sample uniform from 0 meters to 1 meters

end organism

start unit year

  alias years
  alias yr
  alias yrs

end unit

What’s Next?

joshpy can do much more:

Feature Description
Parameter Sweeps Run multiple configurations automatically
Experiment Registry Track runs, configs, and results in DuckDB
Result Analysis Query and visualize across parameter values
Diagnostic Plots Quick sanity-check visualizations

Next Steps