Gap Filling & Smoothing
date: 2025-01-15
authors:
    - name: Brookie Guzder-Williams
affiliations:
    - University of California Berkeley, The Eric and Wendy Schmidt Center for Data Science & Environment
license: CC-BY-4.0
This notebook shows how DSE’s Spectral Trend Database (STDB) processes data to create daily-smoothed values. The steps are:
- Perform Linear interpolation to create a daily time-series
- Replace points where the time-series has a large drop using linear interpolation. Specifically, we create a smoothed curve by performing symmetrical mean smoothing over a 32 day window. We then remove, and then replace, points where the time-series data divide by the smoothed data is less than 0.5.
- Apply scipy’s Savitzky Golay filter with window length 60, and polyorder 3.
IMPORTS
from typing import Callable, Union, Optional, Literal, TypeAlias, Sequence, Any
import matplotlib.pyplot as plt
import seaborn as sns
import altair as alt
from spectral_trend_database.config import config as c
from spectral_trend_database import query
from spectral_trend_database import utils
from spectral_trend_database import smoothing
from spectral_trend_database import types
CONFIG
BQ_PREFIX = 'dse-regenag.SpectralTrendDatabase'
SAMPLE_FRAC = '0.001'
YEAR_START = 2010
YEAR_END = 2011
START_MMDD = '11-01'
END_MMDD = START_MMDD
ATTR_COLS = [
    'sample_id',
    'lon',
    'lat',
    'year']
SAMPLE_ID = 'dp176ckyu6n'
HELPER METHODS
def print_list(lst, max_len=7, view_size=3, sep=', ', connector=' ... '):
    size = len(lst)
    if size <= max_len:
        lst_str = sep.join(lst)
    else:
        head = sep.join(lst[:view_size])
        tail = sep.join(lst[-view_size:])
        lst_str = f'{head}{connector}{tail}  [{size}]'
    print(lst_str)

def line(marker='-', length=100):
    print(marker*length)
FETCH DATA
meta_columns = ['sample_id', 'lon', 'lat', 'year']
qc = query.QueryConstructor('SAMPLE_POINTS', table_prefix=BQ_PREFIX)
qc.join('RAW_INDICES_V1', 'sample_id')
qc.select(*meta_columns, 'date', 'ndvi')
qc.where(sample_id=SAMPLE_ID)
qc.where('RAW_INDICES_V1', year=YEAR_START, year_op='>=')
qc.where('RAW_INDICES_V1', year=YEAR_END, year_op='<=')
qc.orderby('date', table='RAW_INDICES_V1')
df = query.run(sql=qc.sql(), print_sql=True)
print('nb_rows:', df.shape[0])
[info] spectral_trend_database.query.run: SELECT sample_id, lon, lat, year, date, ndvi FROM `dse-regenag.SpectralTrendDatabase.SAMPLE_POINTS` LEFT JOIN `dse-regenag.SpectralTrendDatabase.RAW_INDICES_V1` USING (sample_id) WHERE `dse-regenag.SpectralTrendDatabase.SAMPLE_POINTS`.sample_id = "dp176ckyu6n" AND `dse-regenag.SpectralTrendDatabase.RAW_INDICES_V1`.year >= 2010 AND `dse-regenag.SpectralTrendDatabase.RAW_INDICES_V1`.year <= 2011 ORDER BY `dse-regenag.SpectralTrendDatabase.RAW_INDICES_V1`.date ASC
nb_rows: 59
ds = utils.rows_to_xr(df, attr_cols=meta_columns)
ds
Loading...
The work is being managed by spectral_trend_database.smoothing.savitzky_golay_processor
_ds = smoothing.savitzky_golay_processor(ds, rename=[])
display(_ds)
fig, ax = plt.subplots(figsize=(12, 2))
display(_ds.ndvi.plot())
Loading...
which looks like this:
def savitzky_golay_processor(
        data: types.NPXR,
        window_length: int = utils.DEFAULT_SG_WINDOW_LENGTH,
        polyorder: int = utils.DEFAULT_SG_POLYORDER,
        daily_args: Optional[types.ARGS_KWARGS] = None,
        remove_drops_args: Optional[types.ARGS_KWARGS] = None,
        interpolate_args: Optional[types.ARGS_KWARGS] = None,
        data_vars: Optional[Sequence[Union[str, Sequence]]] = None,
        exclude: Sequence[str] = [],
        rename: Union[dict[str, str], Sequence[dict[str, str]]] = {},
        **kwargs) -> types.NPXR:
    """

    Wrapper for `spectral_trend_database.utils.npxr.sequence` to run a series of smoothing steps

    Steps:
        1. daily_dataset
        2. interpolate_na
        3. remove_drops
        4. interpolate_na
        5. npxr_savitzky_golay

    Args:

        data (types.NPXR): source data
        window_length (int = DEFAULT_SG_WINDOW_LENGTH): window_length for sig.savgol_filter
        polyorder (int = DEFAULT_SG_POLYORDER): polyorder for sig.savgol_filter
        daily_args (Optional[types.ARGS_KWARGS] = None):

        remove_drops_args (Optional[types.ARGS_KWARGS] = None):

        interpolate_args (Optional[types.ARGS_KWARGS] = None):

        data_vars (Optional[Sequence[Union[str, Sequence]]] = None):

        exclude (Sequence[str] = []):

        rename (Union[dict[str, str], Sequence[dict[str, str]]] = {}):
        **kwargs: additional kwargs for sig.savgol_filter

    Returns:

        (types.NPXR) data with smoothed data values
    """
    kwargs['window_length'] = window_length
    kwargs['polyorder'] = polyorder
    func_list = [
        daily_dataset,
        interpolate_na,
        remove_drops,
        interpolate_na,
        npxr_savitzky_golay
    ]
    args_list = [
        daily_args,
        interpolate_args,
        remove_drops_args,
        interpolate_args,
        kwargs
    ]
    return sequencer(
        data,
        data_vars=data_vars,
        exclude=exclude,
        rename=rename,
        func_list=func_list,
        args_list=args_list)
For this examplew we’ll break the savitzky_golay_processor up into the three steps defined above, namely:
linear_interp: Perform Linear interpolation to create a daily time-seriesreplace_drops: Replace points where the time-series has a large drop using linear interpolation. Specifically, we create a smoothed curve by performing symmetrical mean smoothing over a 32 day window. We then remove, and then replace, points where the time-series data divide by the smoothed data is less than 0.5.sg_filter: Apply scipy’s Savitzky Golay filter with window length 60, and polyorder 3.
def linear_interp(
        data: types.NPXR,
        daily_args: Optional[types.ARGS_KWARGS] = None,
        interpolate_args: Optional[types.ARGS_KWARGS] = None,
        rename: Union[dict[str, str], Sequence[dict[str, str]]] = {}) -> types.NPXR:
    func_list = [
        smoothing.daily_dataset,
        smoothing.interpolate_na,
    ]
    args_list = [
        daily_args,
        interpolate_args
    ]
    return smoothing.sequencer(
        data,
        rename=rename,
        func_list=func_list,
        args_list=args_list)

def replace_drops(
        data: types.NPXR,
        remove_drops_args: Optional[types.ARGS_KWARGS] = None,
        interpolate_args: Optional[types.ARGS_KWARGS] = None,
        rename: Union[dict[str, str], Sequence[dict[str, str]]] = {},
        **kwargs) -> types.NPXR:
    func_list = [
        smoothing.remove_drops,
        smoothing.interpolate_na,
    ]
    args_list = [
        remove_drops_args,
        interpolate_args,
    ]
    return smoothing.sequencer(
        data,
        rename=rename,
        func_list=func_list,
        args_list=args_list)

def sg_filter(
        data: types.NPXR,
        window_length: int = smoothing.DEFAULT_SG_WINDOW_LENGTH,
        polyorder: int = smoothing.DEFAULT_SG_POLYORDER,
        rename: Union[dict[str, str], Sequence[dict[str, str]]] = {},
        **kwargs) -> types.NPXR:
    """
    NOTE: this is just a complicated wrapping of `smoothing.npxr_savitzky_golay`. Keeping it
    in this format for consistency with `smoothing.savitzky_golay_processor` and the above
    methods (linear_interp, replace_drops).
    """
    kwargs['window_length'] = window_length
    kwargs['polyorder'] = polyorder
    func_list = [
        smoothing.npxr_savitzky_golay
    ]
    args_list = [
        kwargs
    ]
    return smoothing.sequencer(
        data,
        rename=rename,
        func_list=func_list,
        args_list=args_list)
ds_1 = linear_interp(ds, rename=dict(ndvi='ndvi_linear_interp'))
ds_2 = replace_drops(ds_1, rename=dict(ndvi_linear_interp='ndvi_remove_drops'))
ds_3 = sg_filter(ds_2, rename=dict(ndvi_remove_drops='ndvi_sg'))ds_smoothed = utils.npxr_stack([ds_1, ds_2, ds_3], dim='date')
display(ds_smoothed)Loading...
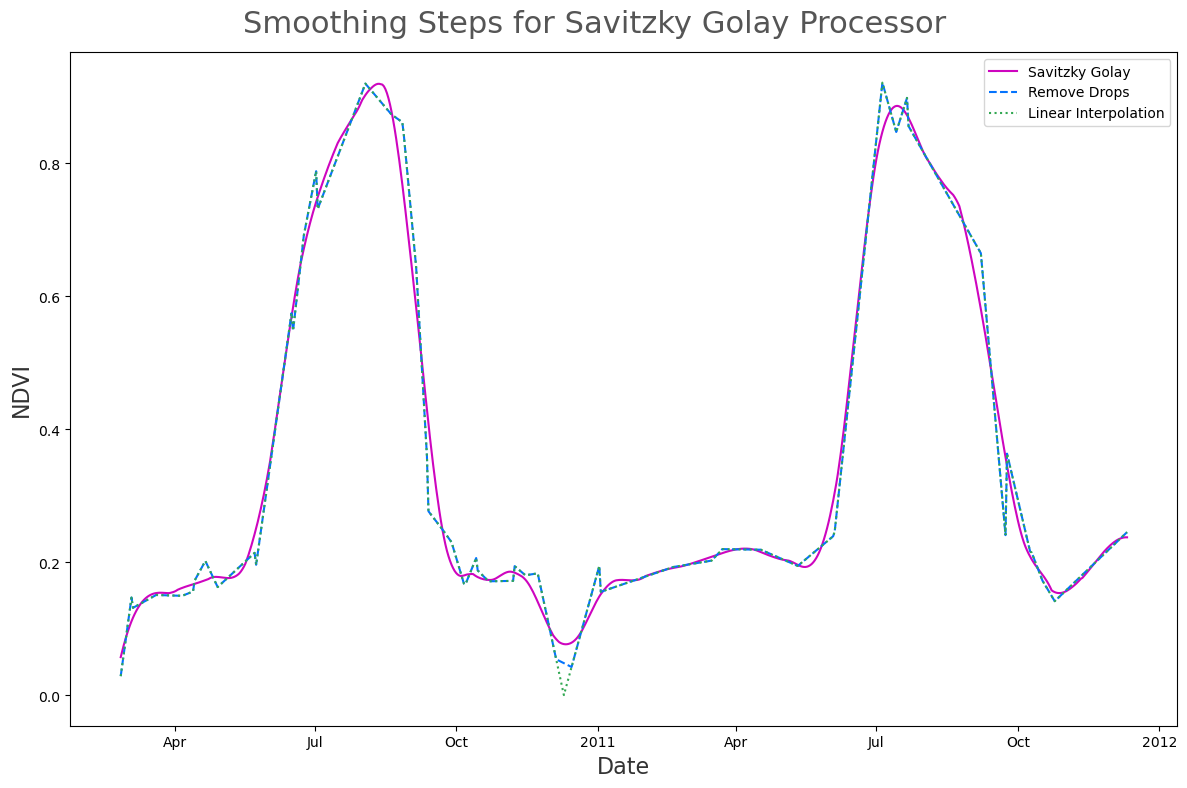
SUPTITLE_FONT_SIZE = 22
SUPTITLE_CLR = '#555'
LABEL_FONT_SIZE = 16
LABEL_CLR = '#333'

fig, ax = plt.subplots(figsize=(12, 8))
ds_smoothed.ndvi_sg.plot(color='#ce05bf', label='Savitzky Golay')
ds_smoothed.ndvi_remove_drops.plot(color='#0473fd', linestyle='dashed', label='Remove Drops')
ds_smoothed.ndvi_linear_interp.plot(color='#32a852', linestyle='dotted', label='Linear Interpolation')
plt.suptitle(
    'Smoothing Steps for Savitzky Golay Processor',
    fontsize=SUPTITLE_FONT_SIZE,
    color=SUPTITLE_CLR)
ax.set_ylabel('NDVI', fontsize=LABEL_FONT_SIZE, color=LABEL_CLR)
ax.set_xlabel('Date', fontsize=LABEL_FONT_SIZE, color=LABEL_CLR)
plt.legend(loc=1)
plt.tight_layout()